Field Testing
Problem: Having verified the performance of the design in the lab using my own booster pumps, I needed to test the device against actual booster pumps and system conditions.
Analysis: Given the high amount of variation between houses, comparing each house against itself with and without a valve installed would increase the signal-to-noise ratio in my experiment and improve its statistical power. Installing a pressure logger immediately upstream of the valve would give the best indication of the valve’s performance. Finally, installing a bypass loop would allow households to opt out of the test at anytime without needing a plumber and would make switching between the control and treatment at each house easier.
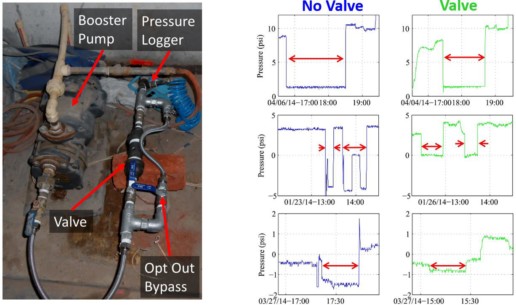

Aggregate Performance: The valve was tested at 19 houses for more than 24 hours with and without the valve; houses were spread across several different neighborhoods in Delhi. The valve proved most effective at eliminating negative pressure if the pressure was below -1psi.
In an intermittent system there are multiple causes of negative pressure: booster pumps, system events, gravity during non-supply-hours, or neighbor’s booster pumps. The valve can only prevent booster-pump-induced negative pressure.
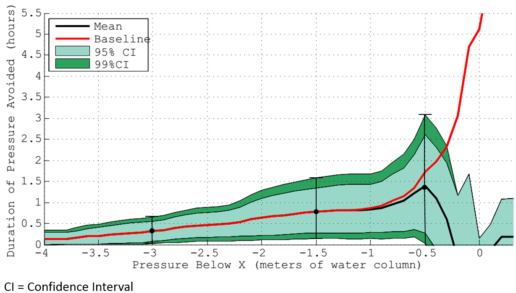
I created an algorithm to read the pressure signatures and assign a probability that the pressure signature was caused by a booster pump. Using these probabilities, I then compared how much booster-pump-induced negative pressure was present with and without the valve.
In the figure below, red is the amount of booster-pump induced negative pressure without the valve and black is the amount of booster-pump-induced negative pressure with the valve. Light and dark green are the confidence intervals. The valve was most effective at preventing pressure below -1psi (-0.7m).
Performance Interpretation:
The valve prevented almost all of the pressure observed to be below -1psi. The presence of the valve prevented a mean of 1.5 hours per day of pressure below -1psi (95% confidence interval of (0.3,2.2)).
Unfortunately, the valve’s ability to prevent mild negative pressure dropped off greatly as the pressure threshold approached atmospheric. I hypothesized two possible reasons for this:
- The valve’s set-point was atmospheric pressure, so the expected performance was to shift severe negative pressure into exactly atmospheric pressure. If the valve shifted the negative pressure to -0.1psi instead, for example, the total duration of pressure below -0.1psi would remain unchanged.
- Given the amount of time spent at atmospheric pressure due to intermittency, the signal-to-noise ratio near atmospheric pressure was much lower and so the valve’s performance would naturally be less statistically significant.
Remaining Issues: Resolving the valve’s poorer performance at pressures close to atmospheric should be addressed in future designs. Further, the tests in Delhi only verified the performance of the valve on individual houses. The next test will observe how the valve would change the system’s behavior, when installed in large quantities. A larger scale trial is needed.
Other Design Stages: The overview of this design is here. But more detailed entries about other design stages are linked to below:
- Problem Analysis & Initial Strategy Selection – choosing a pressure sustaining valve
- Concept Generation and Selection – choosing a Starting resistor
- Concept Refinement – inventing a stabilized Starling resistor
- Tamper Proofing – separating the user from the sensitive parts
- Increasing Durability – moving away from plastic parts
- Decreasing Costs – reducing the part count and complexity
- Field Testing – verifying performance in Delhi